

Mobile App Pairing
Learn how to pair the pascom mobile app with your desktop application to stay professionally reachable even when you're on the move.
These Guides are often needed.

Learn how to pair the pascom mobile app with your desktop application to stay professionally reachable even when you're on the move.
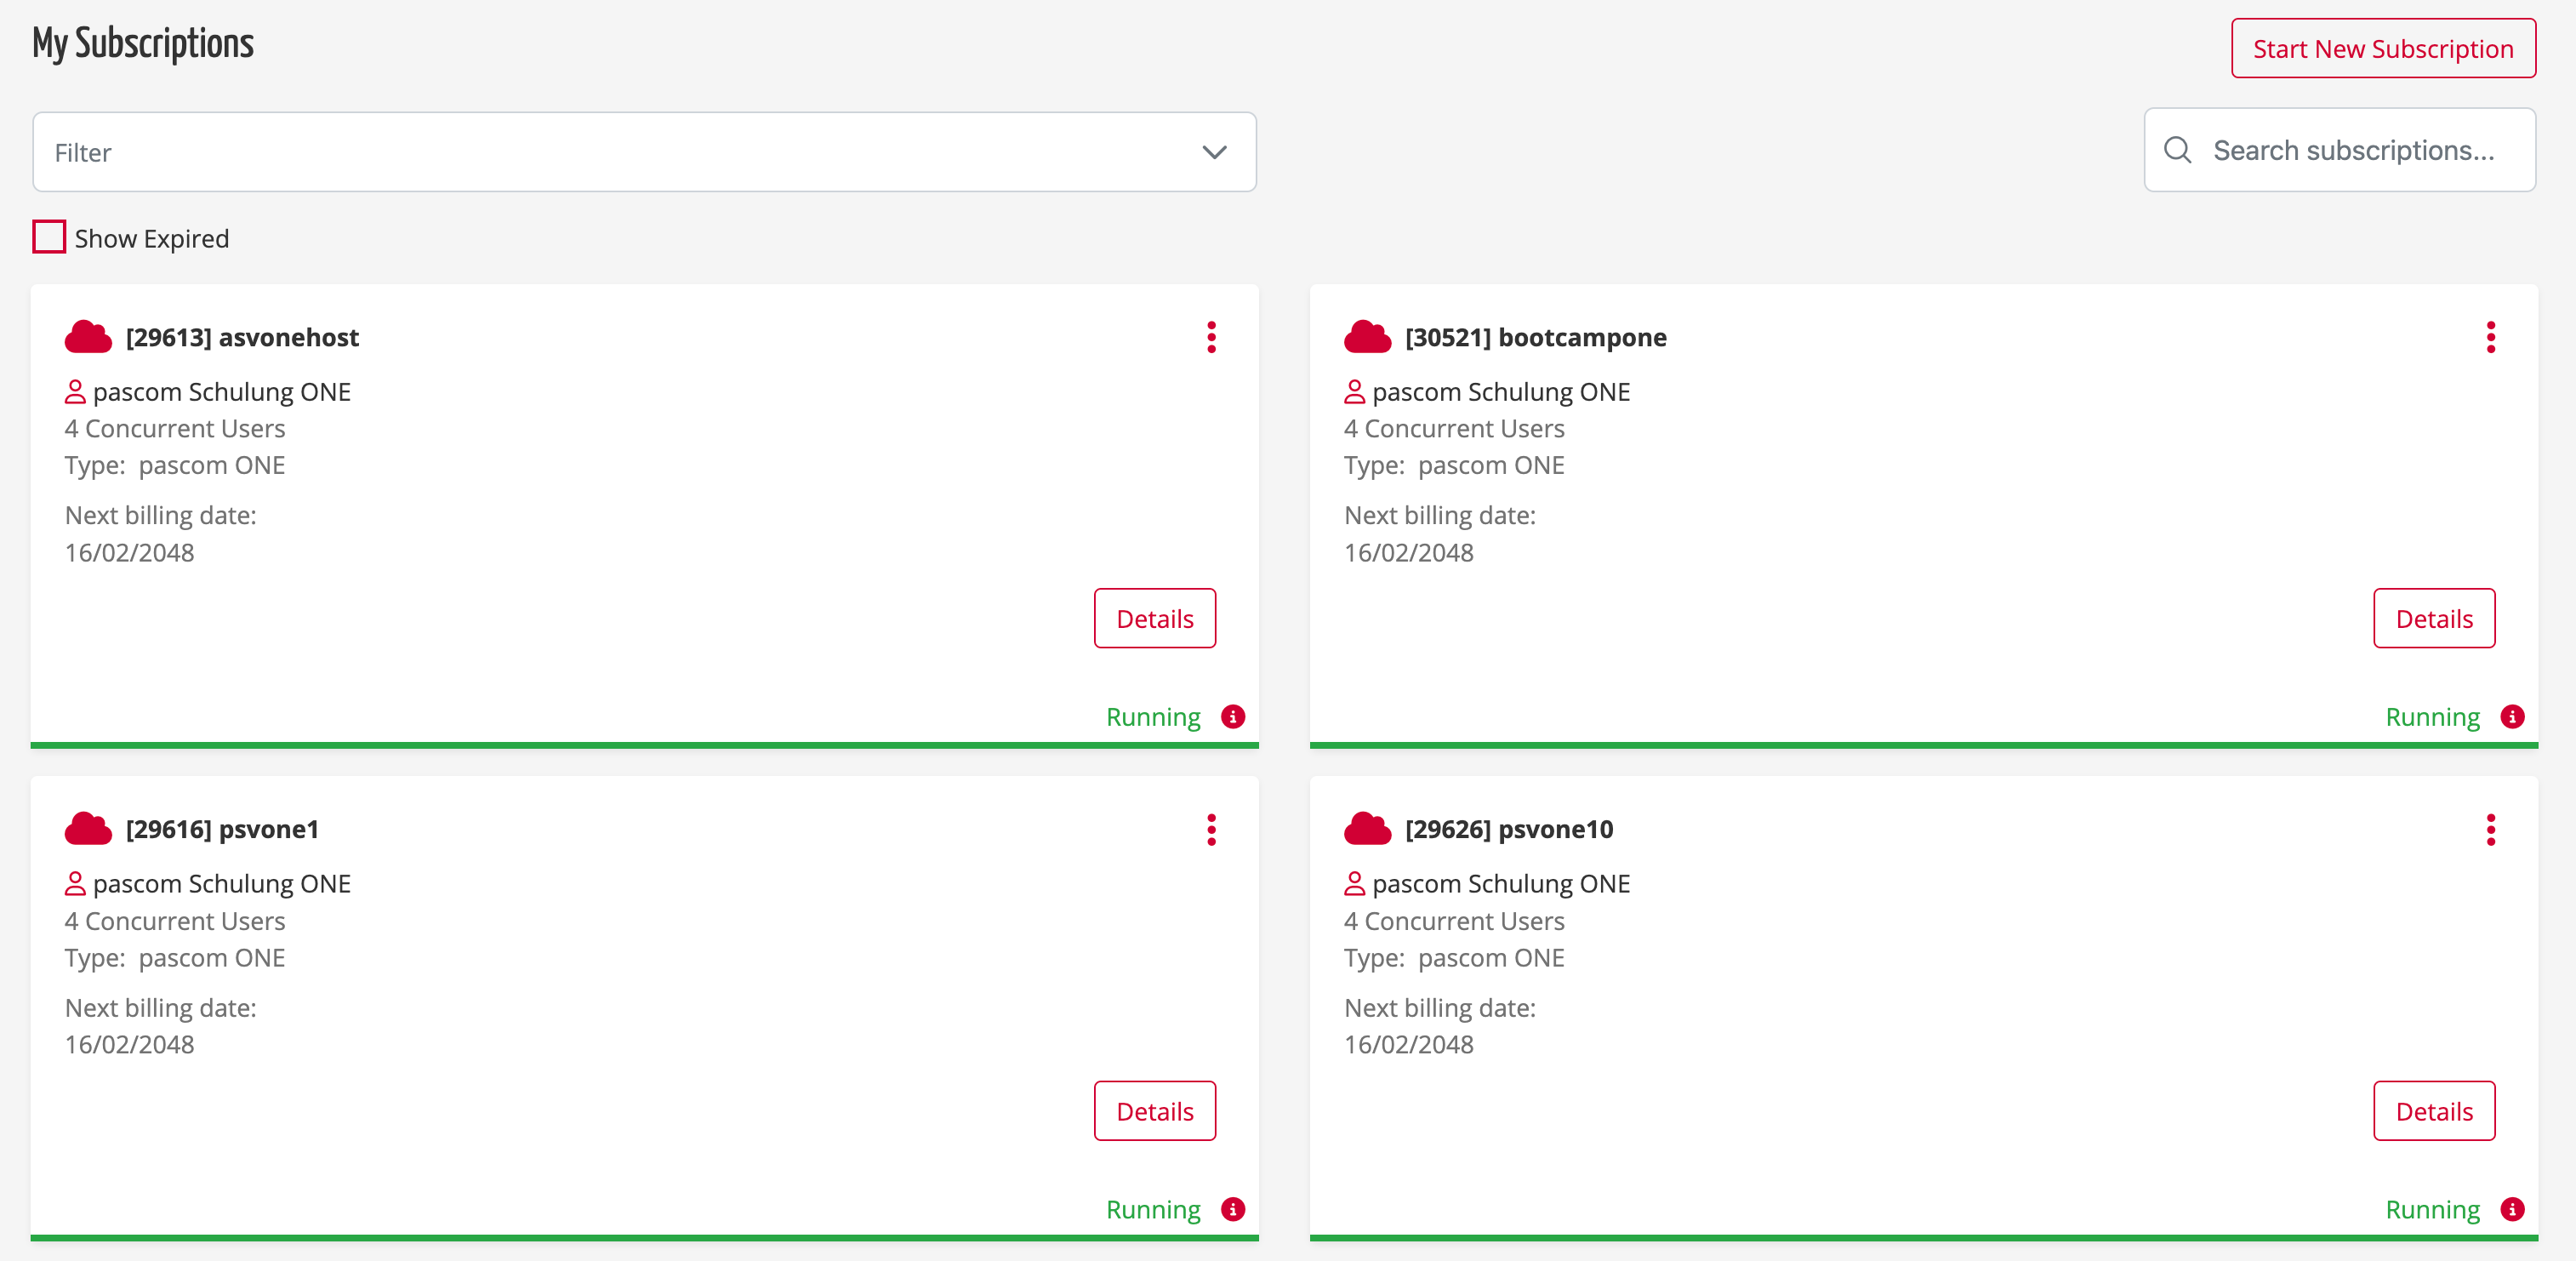
Here you can find useful information about your own subscriptions.

Here we explain the use of the pascom SIP Trunk.

Here you will find useful information on reasons for rejection that can occur during porting and how to avoid these problems.
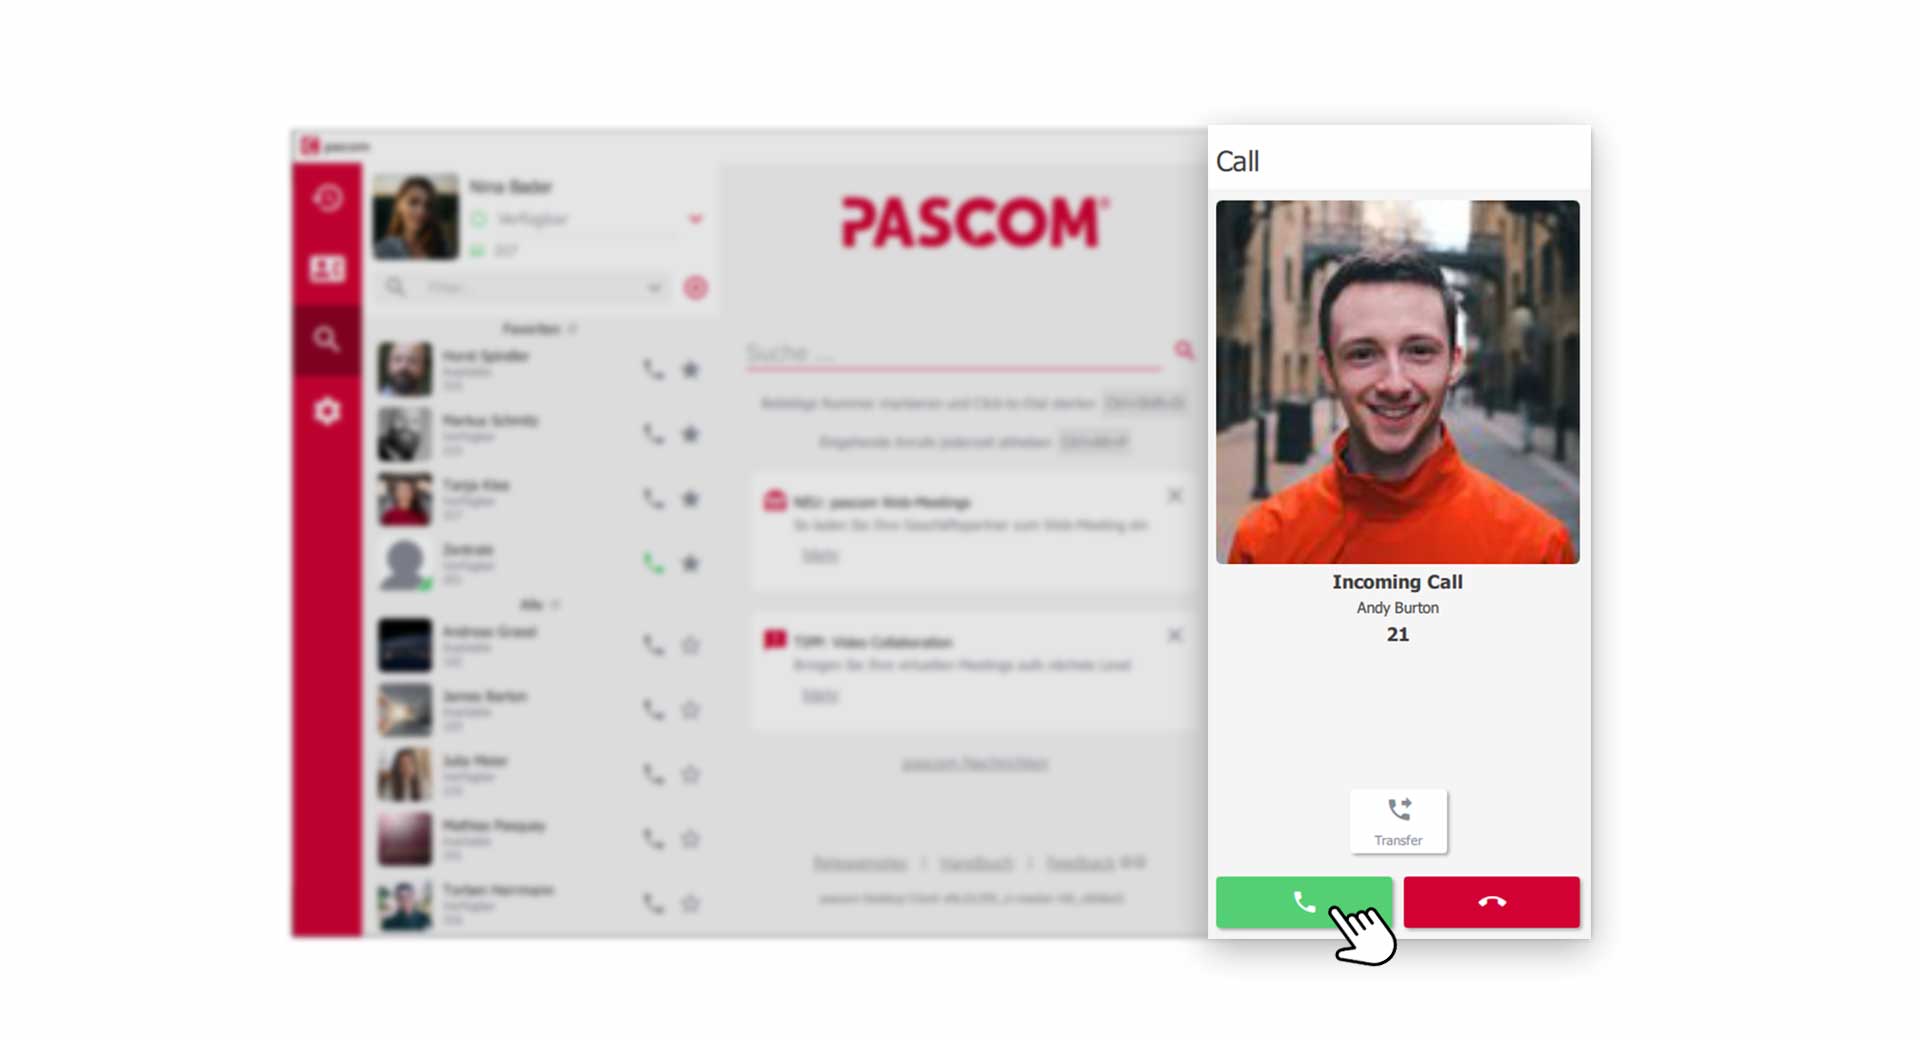
This guide provides an overview of the functions of the telephony area in the pascom app.
Frequently asked questions and answers on data protection and IT operations in the pascom cloud
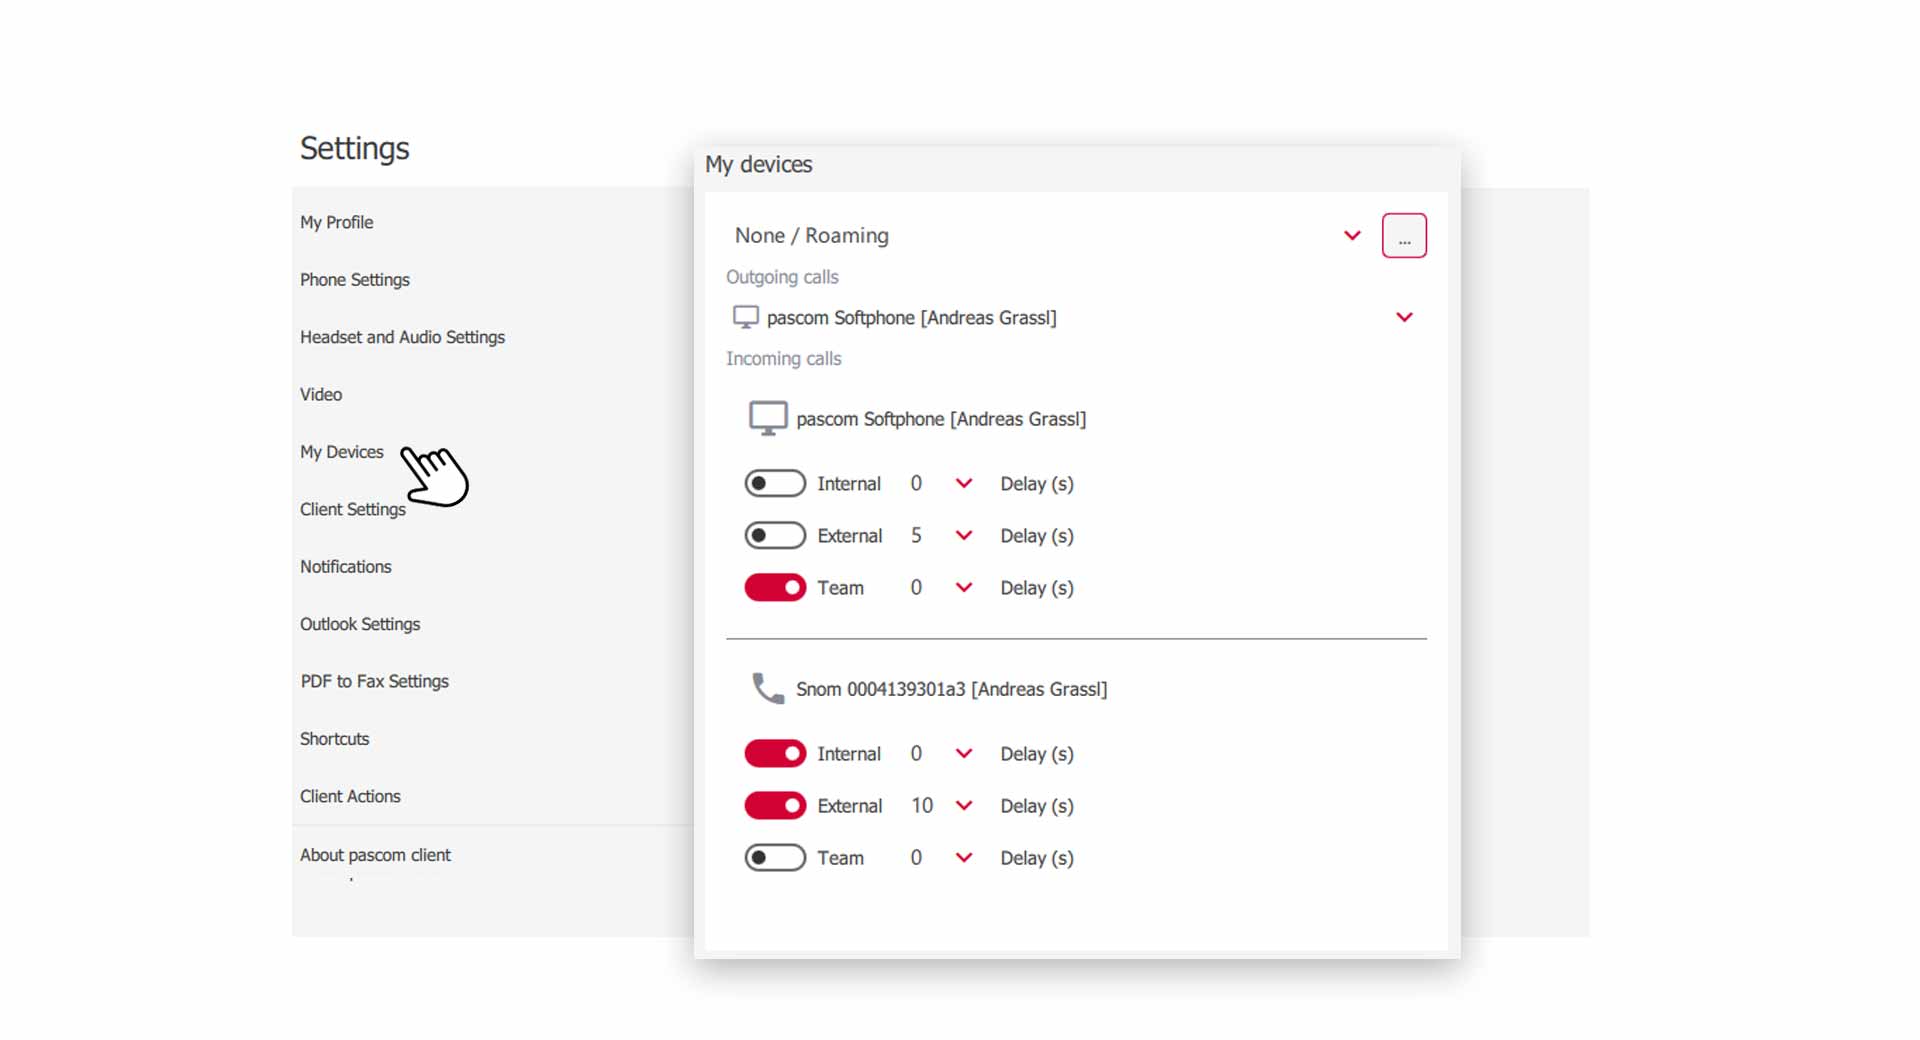
In this guide we explain how to use the Find Me Follow Me settings to control how and when your devices ring.
Here you can find an overview of limitations of file sizes, retentions and periods of data storage.
Here you will find the latest changes in the pascom documentation.
Set up, configure, and test welcome agents
Time-controlled direct-dial switch for automation systems
New: Setup of the WhatsApp Business Connector.
Update: how to use tomedo® together with pascom